
파일:1880- Global average sea level rise (SLR) - annually.svg

SVG 파일의 PNG 형식의 미리보기 크기: 800 × 450 픽셀. 다른 해상도: 320 × 180 픽셀 | 640 × 360 픽셀 | 1,024 × 576 픽셀 | 1,280 × 720 픽셀 | 2,560 × 1,440 픽셀 | 1,200 × 675 픽셀
원본 파일 (SVG 파일, 실제 크기 1,200 × 675 픽셀, 파일 크기: 6 KB)
파일 설명
| 설명 |
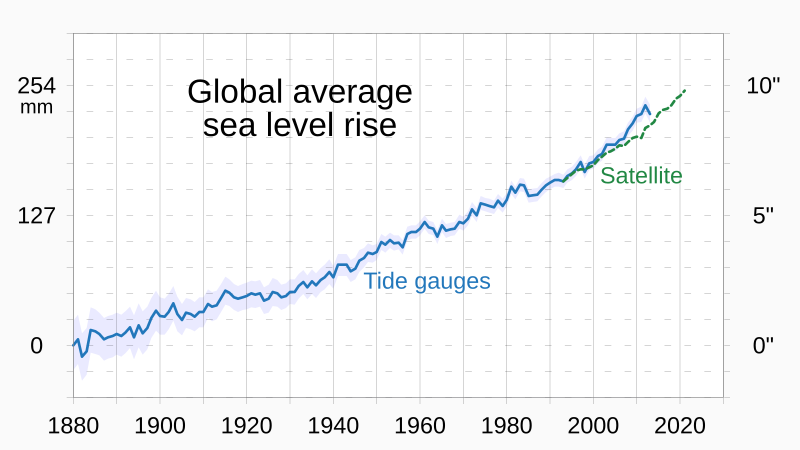
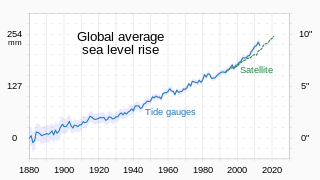
English: Chart showing global average sea level rise (SLR), annually
|
||
| 날짜 | |||
| 출처 | 자작 | ||
| 저자 | RCraig09 |
_-_annually.svg)
_-_annually.svg?uselang=ko)
라이선스
나는 아래 작품의 저작권자로서, 이 저작물을 다음과 같은 라이선스로 배포합니다:
이 파일은 크리에이티브 커먼즈 저작자표시-동일조건변경허락 4.0 국제 라이선스로 배포됩니다.
- 이용자는 다음의 권리를 갖습니다:
- 공유 및 이용 – 저작물의 복제, 배포, 전시, 공연 및 공중송신
- 재창작 – 저작물의 개작, 수정, 2차적저작물 창작
- 다음과 같은 조건을 따라야 합니다:
- 저작자표시 – 적절한 저작자 표시를 제공하고, 라이센스에 대한 링크를 제공하고, 변경사항이 있는지를 표시해야 합니다. 당신은 합리적인 방식으로 표시할 수 있지만, 어떤 방식으로든 사용권 허가자가 당신 또는 당신의 사용을 지지하는 방식으로 표시할 수 없습니다.
- 동일조건변경허락 – 만약 당신이 이 저작물을 리믹스 또는 변형하거나 이 저작물을 기반으로 제작하는 경우, 당신은 당신의 기여물을 원저작물과 동일하거나 호환 가능한 라이선스에 따라 배포하여야 합니다.
파일 역사
날짜/시간 링크를 클릭하면 해당 시간의 파일을 볼 수 있습니다.
| 날짜/시간 | 섬네일 | 크기 | 사용자 | 설명 | |
|---|---|---|---|---|---|
| 현재 | 2023년 10월 29일 (일) 02:13 | | 1,200 × 675 (6 KB) | RCraig09 | Version 2: place international units on left axis, per suggestion on Talk Page |
| 2023년 10월 26일 (목) 14:53 |  | 1,200 × 675 (6 KB) | RCraig09 | Uploaded own work with UploadWizard |
이 파일을 사용하는 문서
다음 문서 2개가 이 파일을 사용하고 있습니다:
이 파일을 사용하고 있는 모든 위키의 문서 목록
다음 위키에서 이 파일을 사용하고 있습니다:
- bn.wikipedia.org에서 이 파일을 사용하고 있는 문서 목록
- cs.wikipedia.org에서 이 파일을 사용하고 있는 문서 목록
- en.wikipedia.org에서 이 파일을 사용하고 있는 문서 목록
- uz.wikipedia.org에서 이 파일을 사용하고 있는 문서 목록
_-_annually.svg)