
파일:20211109 Frequency of extreme weather for different degrees of global warming - bar chart IPCC AR6 WG1 SPM.svg

SVG 파일의 PNG 형식의 미리보기 크기: 800 × 450 픽셀. 다른 해상도: 320 × 180 픽셀 | 640 × 360 픽셀 | 1,024 × 576 픽셀 | 1,280 × 720 픽셀 | 2,560 × 1,440 픽셀 | 1,200 × 675 픽셀
원본 파일 (SVG 파일, 실제 크기 1,200 × 675 픽셀, 파일 크기: 5 KB)
파일 설명
| 설명 |
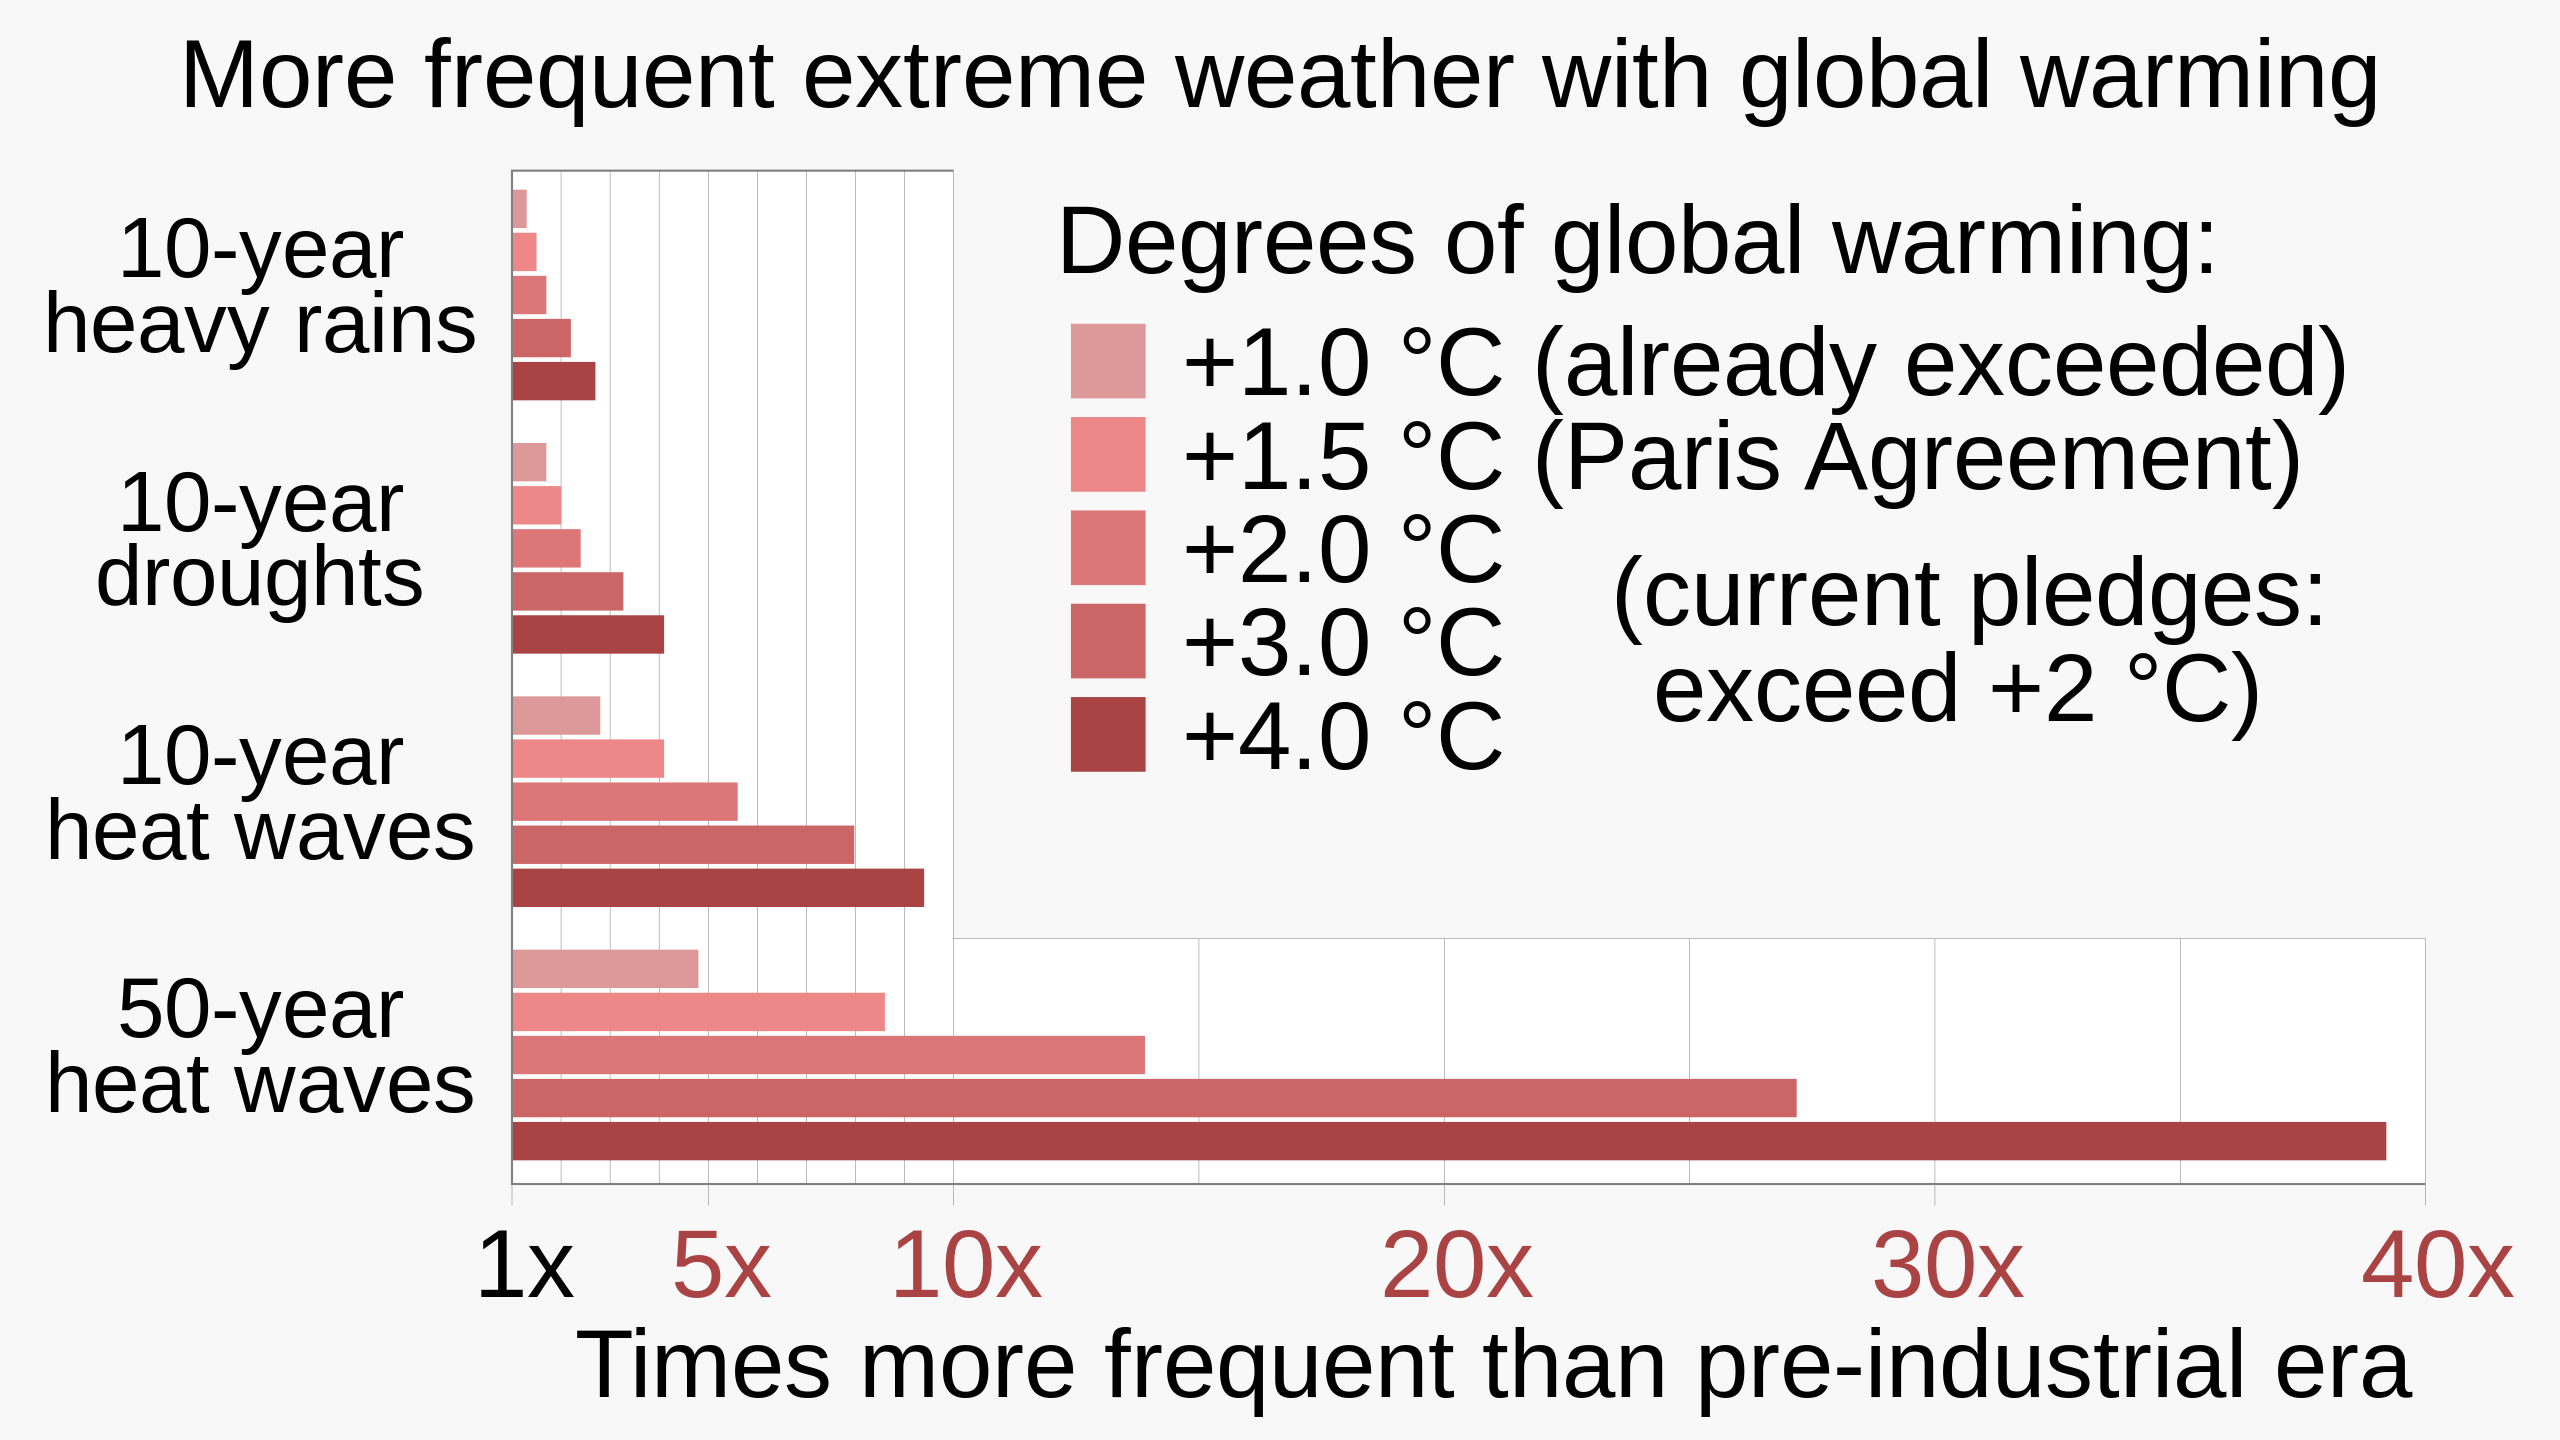
English: Bar chart showing frequency of extreme weather for different degrees of global warming, based on data from IPCC AR6 WG1 SPM (Summary for Policy Makers).
|
||||
| 날짜 | |||||
| 출처 | 자작 | ||||
| 저자 | RCraig09 | ||||
| 다른 버전 |
|


Related files
The following files are based on Fig. SPM.6 of the Sixth Assessment Report of the Intergovernmental Panel on Climate Change / Summary for Policymakers:
-
 20210809 Projected extremes for different degrees of global warming - IPCC AR6 WG1 SPM.svg
9 August 2021: Line chart of 10- and 50-year datasets (includes frequency, omits intensity) -
 20211107 Projected extremes for different degrees of global warming - 3x10yr area chart - IPCC AR6 WG1 SPM.svg
7 Nov 2021: "L" charts includes both frequency and intensity of the 10-year datasets (omits 50-year dataset) -
 20211109 Frequency of extreme weather for different degrees of global warming - bar chart IPCC AR6 WG1 SPM.svg
9 Nov 2021: Bar chart of 10- and 50-year datasets (includes frequency, omits intensity) -
 20220208 Projected temperature extremes for different degrees of global warming - orthogonal bar chart - IPCC AR6 WG1 SPM.svg
Orthogonal bar chart of 10-year heat waves (only)


라이선스
나는 아래 작품의 저작권자로서, 이 저작물을 다음과 같은 라이선스로 배포합니다:
이 파일은 크리에이티브 커먼즈 저작자표시-동일조건변경허락 4.0 국제 라이선스로 배포됩니다.
- 이용자는 다음의 권리를 갖습니다:
- 공유 및 이용 – 저작물의 복제, 배포, 전시, 공연 및 공중송신
- 재창작 – 저작물의 개작, 수정, 2차적저작물 창작
- 다음과 같은 조건을 따라야 합니다:
- 저작자표시 – 적절한 저작자 표시를 제공하고, 라이센스에 대한 링크를 제공하고, 변경사항이 있는지를 표시해야 합니다. 당신은 합리적인 방식으로 표시할 수 있지만, 어떤 방식으로든 사용권 허가자가 당신 또는 당신의 사용을 지지하는 방식으로 표시할 수 없습니다.
- 동일조건변경허락 – 만약 당신이 이 저작물을 리믹스 또는 변형하거나 이 저작물을 기반으로 제작하는 경우, 당신은 당신의 기여물을 원저작물과 동일하거나 호환 가능한 라이선스에 따라 배포하여야 합니다.
파일 역사
날짜/시간 링크를 클릭하면 해당 시간의 파일을 볼 수 있습니다.
| 날짜/시간 | 섬네일 | 크기 | 사용자 | 설명 | |
|---|---|---|---|---|---|
| 현재 | 2023년 7월 30일 (일) 05:44 | | 1,200 × 675 (5 KB) | RCraig09 | Version 12: remove <tspan> declarations embedded within <text> in the title "More frequent...", to work around ongoing text rendering problems on Wikimedia |
| 2023년 7월 30일 (일) 05:29 |  | 1,200 × 675 (5 KB) | RCraig09 | Version 11: manually changing "+1.1 °C today" to "(already exceeded)" (in the English language portion) to future-proof this graphic . . . . retained JP translation <switch> elements without change | |
| 2022년 9월 6일 (화) 13:57 |  | 1,200 × 675 (5 KB) | Icosohedral | File uploaded using svgtranslate tool (https://svgtranslate.toolforge.org/). Added translation for zh. | |
| 2021년 12월 22일 (수) 02:19 |  | 1,200 × 675 (3 KB) | RCraig09 | Version 9: misc changes per suggestions on this file's Talk page. | |
| 2021년 11월 22일 (월) 14:31 |  | 1,200 × 675 (3 KB) | RCraig09 | Version 8: more exact 3.0 C values . . . colors of horizontal axis tick labels | |
| 2021년 11월 18일 (목) 12:40 |  | 1,200 × 675 (3 KB) | RCraig09 | Version 7: adding to legend, 2.7 C under current pledges, per discussions at en.wp's Talk:Climate change | |
| 2021년 11월 17일 (수) 13:58 |  | 1,200 × 675 (4 KB) | RCraig09 | Version 6: Enlarge some font sizes . . . . change some text | |
| 2021년 11월 16일 (화) 15:07 |  | 1,200 × 675 (4 KB) | RCraig09 | Version 5: Used Liberation Sans . . . changed legend to "Present-day =+1.1 C" | |
| 2021년 11월 14일 (일) 03:25 |  | 1,200 × 675 (4 KB) | RCraig09 | Version 4: includes thinner, white vertical gridlines that overlay the colored bars, to make it easier to determine extent of the bars. Darker, wider gridlines remain behind the gridlines so they're visible over the white background. | |
| 2021년 11월 13일 (토) 13:21 |  | 1,200 × 675 (4 KB) | RCraig09 | Version 3: reduced length of some vertical grid lines; removed most of the plot-area outline. |
이 파일을 사용하는 문서
다음 문서 1개가 이 파일을 사용하고 있습니다:
이 파일을 사용하고 있는 모든 위키의 문서 목록
다음 위키에서 이 파일을 사용하고 있습니다:
- bn.wikipedia.org에서 이 파일을 사용하고 있는 문서 목록
- de.wikipedia.org에서 이 파일을 사용하고 있는 문서 목록
- en.wikipedia.org에서 이 파일을 사용하고 있는 문서 목록
- eo.wikipedia.org에서 이 파일을 사용하고 있는 문서 목록
- ms.wikipedia.org에서 이 파일을 사용하고 있는 문서 목록
- pt.wikipedia.org에서 이 파일을 사용하고 있는 문서 목록
- ru.wikipedia.org에서 이 파일을 사용하고 있는 문서 목록
- rw.wikipedia.org에서 이 파일을 사용하고 있는 문서 목록
- tr.wikipedia.org에서 이 파일을 사용하고 있는 문서 목록
- zh.wikipedia.org에서 이 파일을 사용하고 있는 문서 목록