
파일:NSIDC arctic sea ice extent since 1979.svg

SVG 파일의 PNG 형식의 미리보기 크기: 800 × 533 픽셀. 다른 해상도: 320 × 213 픽셀 | 640 × 427 픽셀 | 1,024 × 683 픽셀 | 1,280 × 853 픽셀 | 2,560 × 1,707 픽셀 | 810 × 540 픽셀
원본 파일 (SVG 파일, 실제 크기 810 × 540 픽셀, 파일 크기: 37 KB)
파일 설명
| 설명 |
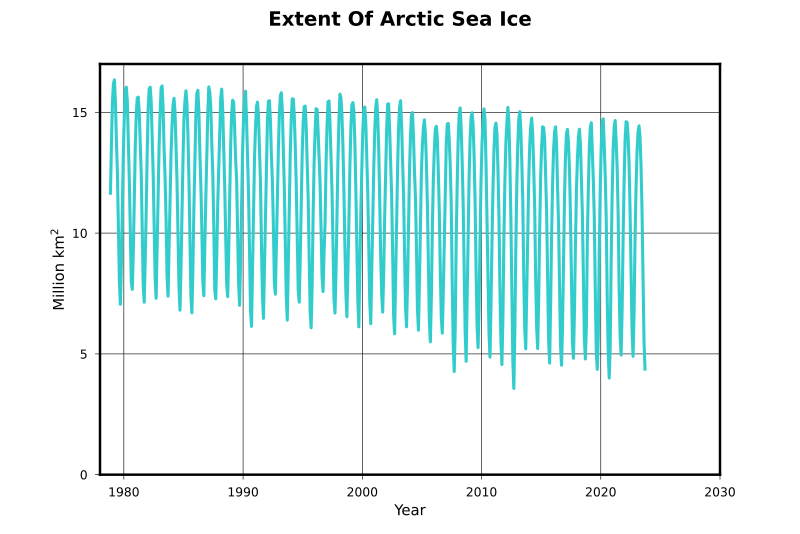
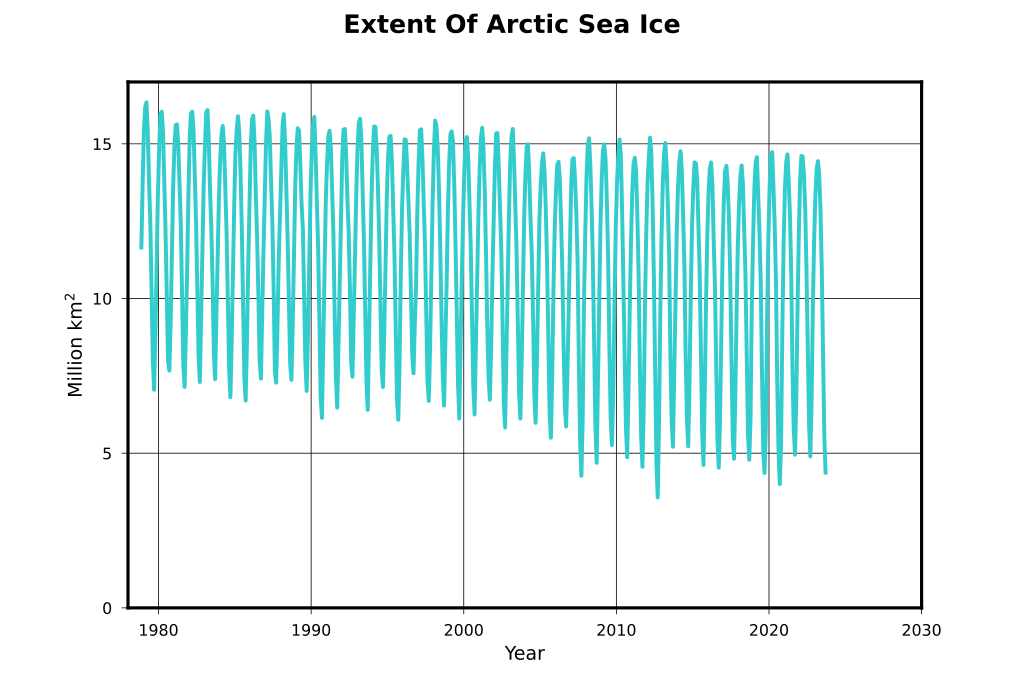
English: Plot of arctic sea ice extent development between 1979 and 2023 in monthly mean values. For the determination of the "area" value, every pixel with a sea ice concentration > .15 is taken. The pixel area is multiplied with the concentration value derived from the passive infrared signal. For the "extent" value, the concentration value is taken as 1, so we basically get full area with >.15 concentration.
Deutsch: Verlauf der Umrissfläche des arktischen Meereises in Monatsmittelwerten von 1979 bis 2023. Für die "area"-Daten werden alle Pixel mit einer Eiskonzentration > 0.15 genommen und deren Fläche mit der Eiskonzentration multipliziert. Für die "extent"-Daten wird diese Eiskonzentration =1 gesetzt - so erhält man die Gesamtfläche mit überhaupt irgendwelchem Eis. |
| 날짜 | |
| 출처 | 자작 |
| 저자 | Dominiklenne |
Data source: Fetterer, F., K. Knowles, W. Meier, and M. Savoie. 2002, updated until 2010. Sea Ice Index. Boulder, Colorado USA: National Snow and Ice Data Center. Digital media. ftp://sidads.colorado.edu/DATASETS/NOAA/G02135/. Corresponding website: http://nsidc.org/data/seaice_index/archives/index.html
For the area definition see: https://nsidc.org/learn/ask-scientist/what-difference-between-sea-ice-area-and-extent
라이선스
| 나는 이 작품의 저작권자로서, 이 작품을 퍼블릭 도메인으로 모두에게 공개합니다. 이 공개 선언은 전 세계적으로 유효합니다. 만약 저작권의 포기가 법률적으로 가능하지 않은 경우, 나는 이 작품을 법적으로 허용되는 한도 내에서 누구나 자유롭게 어떤 목적으로도 제한없이 사용할 수 있도록 허용합니다. |
파일 역사
날짜/시간 링크를 클릭하면 해당 시간의 파일을 볼 수 있습니다.
| 날짜/시간 | 섬네일 | 크기 | 사용자 | 설명 | |
|---|---|---|---|---|---|
| 현재 | 2023년 10월 24일 (화) 02:48 | | 810 × 540 (37 KB) | Dominiklenne | update to october 2023 |
| 2023년 5월 10일 (수) 06:07 |  | 810 × 540 (37 KB) | Dominiklenne | update to april 2023 | |
| 2022년 3월 5일 (토) 04:12 |  | 810 × 540 (36 KB) | Dominiklenne | update until february 2022 | |
| 2020년 11월 7일 (토) 09:39 |  | 810 × 540 (42 KB) | Dominiklenne | update until october 2020 | |
| 2019년 10월 28일 (월) 02:16 |  | 810 × 540 (45 KB) | Dominiklenne | data added until september 2019, year scale extended to 2030 | |
| 2018년 10월 31일 (수) 07:35 |  | 810 × 540 (47 KB) | Dominiklenne | data updated until september 2018 | |
| 2017년 7월 9일 (일) 07:44 |  | 810 × 540 (47 KB) | Dominiklenne | data updated until june 2017 | |
| 2016년 7월 23일 (토) 06:43 |  | 810 × 540 (47 KB) | Dominiklenne | data updated until june 2016 | |
| 2015년 8월 28일 (금) 06:43 |  | 810 × 540 (40 KB) | Dominiklenne | minor y scale change to the same as in https://commons.wikimedia.org/wiki/File:Plot_arctic_sea_ice_area.svg | |
| 2015년 8월 28일 (금) 02:03 |  | 810 × 540 (40 KB) | Dominiklenne | update until 2015 / 07. Use of python matplotlip pyplot instead of Gnumeric. Slightly different y-scale for better exhaustion of plot area. |
이 파일을 사용하는 문서
다음 문서 2개가 이 파일을 사용하고 있습니다:
이 파일을 사용하고 있는 모든 위키의 문서 목록
다음 위키에서 이 파일을 사용하고 있습니다:
- ar.wikipedia.org에서 이 파일을 사용하고 있는 문서 목록
- bn.wikipedia.org에서 이 파일을 사용하고 있는 문서 목록
- de.wikipedia.org에서 이 파일을 사용하고 있는 문서 목록
- en.wikipedia.org에서 이 파일을 사용하고 있는 문서 목록
- fa.wikipedia.org에서 이 파일을 사용하고 있는 문서 목록
- fr.wikipedia.org에서 이 파일을 사용하고 있는 문서 목록
- it.wikipedia.org에서 이 파일을 사용하고 있는 문서 목록
- la.wikipedia.org에서 이 파일을 사용하고 있는 문서 목록
- mk.wikipedia.org에서 이 파일을 사용하고 있는 문서 목록
- nn.wikipedia.org에서 이 파일을 사용하고 있는 문서 목록
- no.wikipedia.org에서 이 파일을 사용하고 있는 문서 목록
- sq.wikipedia.org에서 이 파일을 사용하고 있는 문서 목록
- sv.wikipedia.org에서 이 파일을 사용하고 있는 문서 목록
- uk.wikipedia.org에서 이 파일을 사용하고 있는 문서 목록
- zh.wikipedia.org에서 이 파일을 사용하고 있는 문서 목록