
파일:Polarisation (Linear).svg

원본 파일 (SVG 파일, 실제 크기 250 × 625 픽셀, 파일 크기: 11 KB)
.svg?uselang=ko)
| 설명 |
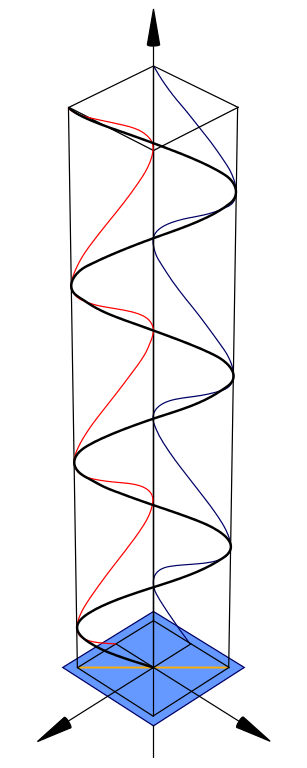
Diagram of linear polarisation. The direction of the black line relative to the central axis represents the direction of the electric field of the linearly polarized light at each point in space. The blue and red lines are projections of the black onto two planes which are at right angles. There is an version which is identical to this original with the exception of phase indictors to make the phase relationship of its components clearer. Refer to Other Versions section below. |
||
| 날짜 | 12/02/07 | ||
| 출처 |
Own drawing down in Mathematica, edited in the Open Source program Inscape. |
||
| 저자 | inductiveload | ||
| 저작권 (이 파일을 인용하기) |
|
||
| 다른 버전 |
이 파일은 다음으로 파생됨: Polarisation (Linear) With.Phase.Indicators.svg Circular polarisation Elliptical polarisation |
_With.Phase.Indicators.svg)
.svg)
.svg)
Mathematica Code
This figure requires the use of Arrow3D, which is not included in the StandardPackages (as of Feb 2007). This can be obtained from Wolfram Research at this location. The required packages are:
<< Graphics`
<< Arrow3D`Arrow3D`
The code is:
wavefunction=ParametricPlot3D[{Sin[4t],-Sin[4t],t},{t,0,5},
    BoxRatios\[Rule]{1,
      1,4},ImageSize\[Rule]400,Boxed\[Rule]False,Axes\[Rule]False,
      PlotPoints\[Rule]60,ViewPoint->{2,2, 2},PlotRange\[Rule]All]

repsi=ParametricPlot3D[{Sin[4t],-1,t,RGBColor[1,0,0]},{t,0,5},
      BoxRatios\[Rule]{4,1,1},ImageSize\[Rule]500,
      Boxed\[Rule]False,Axes\[Rule]False,
        PlotPoints\[Rule]60,PlotRange\[Rule]All]

impsi=ParametricPlot3D[{-1,-Sin[4t],t,RGBColor[0,0,102/255]},{
    t,0,5},BoxRatios\[Rule]{4,1,1},ImageSize\[Rule]500,Boxed\[Rule]False,
      Axes\[Rule]False,PlotPoints\[Rule]60,PlotRange\[Rule]All]

end=ParametricPlot3D[{Sin[t],-Sin[t],0},{t,0,2π},BoxRatios\[Rule]{4,1,1},
    ImageSize\[Rule]500,Boxed\[Rule]False,Axes\[Rule]False,
      PlotPoints\[Rule]10,PlotRange\[Rule]All]

xaxis=Graphics3D[Arrow3D[{0,0,-1},{
  0,0,6},HeadSize \[Rule] UniformSize[.5],HeadColor\[Rule]Black]]

uaxis=Graphics3D[Arrow3D[{0,-1,0},{0,3,0},HeadSize \[Rule]
    UniformSize[.5],HeadColor\[Rule]Black]]

vaxis=Graphics3D[Arrow3D[{-1,0,0},{3,0,0},HeadSize \[Rule]
      UniformSize[.5],HeadColor\[Rule]Black]]

plane=Graphics3D[Polygon[{{1.2,1.2,0},{1.2,-1.2,0},{-1.2,-1.2,0},{-1.2,1.2,0}}\
]]

crate=WireFrame[Graphics3D[Cuboid[{1,1,0},{-1,-1,5}]]]

Show[wavefunction,xaxis,uaxis,vaxis,plane,repsi,impsi,end,crate]
파일 역사
날짜/시간 링크를 클릭하면 해당 시간의 파일을 볼 수 있습니다.
| 날짜/시간 | 섬네일 | 크기 | 사용자 | 설명 | |
|---|---|---|---|---|---|
| 현재 | 2014년 2월 14일 (금) 08:12 | 250 × 625 (11 KB) | 老陳 | Refine detail. At the top end, match red blue and black lines | |
| 2014년 2월 14일 (금) 08:02 | 250 × 625 (11 KB) | 老陳 | The blue line (y component) should be above the darker blue square plate at the bottome. | ||
| 2007년 2월 12일 (월) 15:36 | 250 × 625 (11 KB) | Inductiveload | |||
| 2007년 2월 12일 (월) 12:18 | 250 × 625 (352 KB) | Inductiveload | {{Information |Description=Diagram of linear polarisation |Source=Own drawing down in Mathematica, edited in Inscape. |Date=12/02/07 |Author=inductiveload |Permission={PD-self} |other_versions=Circular polarisation |
.svg)
이 파일을 사용하는 문서
다음 문서 1개가 이 파일을 사용하고 있습니다:
이 파일을 사용하고 있는 모든 위키의 문서 목록
다음 위키에서 이 파일을 사용하고 있습니다:
- bs.wikipedia.org에서 이 파일을 사용하고 있는 문서 목록
- de.wikipedia.org에서 이 파일을 사용하고 있는 문서 목록
- en.wikipedia.org에서 이 파일을 사용하고 있는 문서 목록
- es.wikipedia.org에서 이 파일을 사용하고 있는 문서 목록
- et.wikipedia.org에서 이 파일을 사용하고 있는 문서 목록
- fr.wikipedia.org에서 이 파일을 사용하고 있는 문서 목록
- fr.wikiversity.org에서 이 파일을 사용하고 있는 문서 목록
- he.wikipedia.org에서 이 파일을 사용하고 있는 문서 목록
- mk.wikipedia.org에서 이 파일을 사용하고 있는 문서 목록
- no.wikipedia.org에서 이 파일을 사용하고 있는 문서 목록
- ru.wikipedia.org에서 이 파일을 사용하고 있는 문서 목록
- sh.wikipedia.org에서 이 파일을 사용하고 있는 문서 목록
- tr.wikipedia.org에서 이 파일을 사용하고 있는 문서 목록
- uk.wikipedia.org에서 이 파일을 사용하고 있는 문서 목록
- vi.wikipedia.org에서 이 파일을 사용하고 있는 문서 목록
.svg)