
파일:Global shark catch.svg

SVG 파일의 PNG 형식의 미리보기 크기: 750 × 550 픽셀. 다른 해상도: 320 × 235 픽셀 | 640 × 469 픽셀 | 1,024 × 751 픽셀 | 1,280 × 939 픽셀 | 2,560 × 1,877 픽셀
원본 파일 (SVG 파일, 실제 크기 750 × 550 픽셀, 파일 크기: 8 KB)
파일 설명
| 설명 |
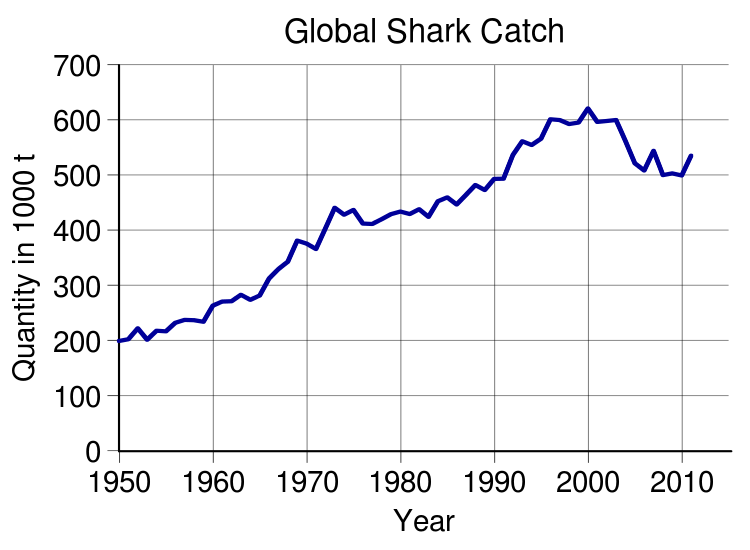
English: Global shark catch Deutsch: weltweiter Hai-Fang
العربية: مخطَّطٌ بياني يُوضّح الزيادة الهائلة في كمية صيد أسماك القرش منذ عام 1950 وحتى عام 2011 وهو ما يؤثّر ولو بشكلٍ غير مباشرٍ على البيئة وعلى عددٍ من الأشياء الأخرى. |
||||||||
| 날짜 | |||||||||
| 출처 |
http://www.fao.org/fishery/statistics/global-capture-production/query/en http://www.fao.org -> Themes -> Fisheries and Aquaculture -> Statistics -> Global Capture Production -> Dataset Global Capture Production (online query)
|
||||||||
| 저자 | Con-struct | ||||||||
| 다른 버전 |
png files:
|
||||||||
| Content | This svg file contains the original graph data. |


Generated with Wikimedia SVG Chart
| Data format | The source data of the chart is in the SVG image file in a clearly readable format. You see the original numbers inside of the SVG file in the form of a list such as this:
... 1995 10.06 1996 11.75 1997 12.45 ... |
| Content of SVG | To view the data download the SVG file itself. To do so right-click this link, and then choose the option to save: File:Global shark catch.svg. Launch any text editor. Open the downloaded SVG file with the text editor (usually; file menu, open). To see the list of data, search for the phrase id="graph1". |
| Please, do not use a special SVG editor such as Inkscape; the readability of the database would be destroyed. You can edit the SVG file with any text editor, for example; en: List of text editors. You can view the edited SVG file in various web browsers. As of 2011, all major desktop browsers, and many minor ones, have some level of SVG support. See: en: Scalable Vector Graphics#Support for SVG in web browsers. When satisfied with your edits, upload the edited SVG file with the link labeled "Upload a new version of this file".
W3C-validity not checked. This chart was created with Wikimedia SVG Chart. 이 SVG 파일은 내장된 문자열을 사용하고 있으며, 숫자만을 사용하고 있습니다. |
|
| Code to generate SVG | See: File talk:Global shark catch.svg. Documentation see: Wikimedia SVG Chart. |
라이선스
나는 아래 작품의 저작권자로서, 이 저작물을 다음과 같은 라이선스로 배포합니다:

|
GNU 자유 문서 사용 허가서 1.2판 또는 자유 소프트웨어 재단에서 발행한 이후 판의 규정에 따라 본 문서를 복제하거나 개작 및 배포할 수 있습니다. 본 문서에는 변경 불가 부분이 없으며, 앞 표지 구절과 뒷 표지 구절도 없습니다. 본 사용 허가서의 전체 내용은 GNU 자유 문서 사용 허가서 부분에 포함되어 있습니다. |
- 이용자는 다음의 권리를 갖습니다:
- 공유 및 이용 – 저작물의 복제, 배포, 전시, 공연 및 공중송신
- 재창작 – 저작물의 개작, 수정, 2차적저작물 창작
- 다음과 같은 조건을 따라야 합니다:
- 저작자표시 – 적절한 저작자 표시를 제공하고, 라이센스에 대한 링크를 제공하고, 변경사항이 있는지를 표시해야 합니다. 당신은 합리적인 방식으로 표시할 수 있지만, 어떤 방식으로든 사용권 허가자가 당신 또는 당신의 사용을 지지하는 방식으로 표시할 수 없습니다.
- 동일조건변경허락 – 만약 당신이 이 저작물을 리믹스 또는 변형하거나 이 저작물을 기반으로 제작하는 경우, 당신은 당신의 기여물을 원저작물과 동일하거나 호환 가능한 라이선스에 따라 배포하여야 합니다.
이 라이선스 중에서 목적에 맞는 것을 선택하여 사용할 수 있습니다.
파일 역사
날짜/시간 링크를 클릭하면 해당 시간의 파일을 볼 수 있습니다.
| 날짜/시간 | 섬네일 | 크기 | 사용자 | 설명 | |
|---|---|---|---|---|---|
| 현재 | 2013년 7월 25일 (목) 16:18 | | 750 × 550 (8 KB) | Con-struct (t) | smaller font size |
| 2013년 7월 25일 (목) 06:29 |  | 750 × 550 (7 KB) | Con-struct | global shark catch |
이 파일을 사용하는 문서
다음 문서 1개가 이 파일을 사용하고 있습니다:
이 파일을 사용하고 있는 모든 위키의 문서 목록
다음 위키에서 이 파일을 사용하고 있습니다:
- ar.wikipedia.org에서 이 파일을 사용하고 있는 문서 목록
- ast.wikipedia.org에서 이 파일을 사용하고 있는 문서 목록
- bg.wikipedia.org에서 이 파일을 사용하고 있는 문서 목록
- de.wikipedia.org에서 이 파일을 사용하고 있는 문서 목록
- en.wikipedia.org에서 이 파일을 사용하고 있는 문서 목록
- es.wikipedia.org에서 이 파일을 사용하고 있는 문서 목록
- fr.wikipedia.org에서 이 파일을 사용하고 있는 문서 목록
- gl.wikipedia.org에서 이 파일을 사용하고 있는 문서 목록
- it.wikipedia.org에서 이 파일을 사용하고 있는 문서 목록
- ja.wikipedia.org에서 이 파일을 사용하고 있는 문서 목록
- pt.wikipedia.org에서 이 파일을 사용하고 있는 문서 목록
- sv.wikipedia.org에서 이 파일을 사용하고 있는 문서 목록
- zh.wikipedia.org에서 이 파일을 사용하고 있는 문서 목록